
 Français
How to Enhance Store Performance with Heatmaps
Use heatmaps in your retail planning to gain a visual overview of product data and improve in-store KPIs such as sell-through, profit margins and more.
A heatmap is a visual representation of data that displays various kinds of information based on color-coding and intensity of the colors therein. In a retail context, and applied to an in-store view, a heatmap can show a simple way to digest important sales and product data to feed back to your merchandising, buying and planning teams at a glance. In this article, we will describe just how you can use heat-maps with digital retail tools (just like MockShop) to identify key product sales bottlenecks and improve your in-store KPIs.
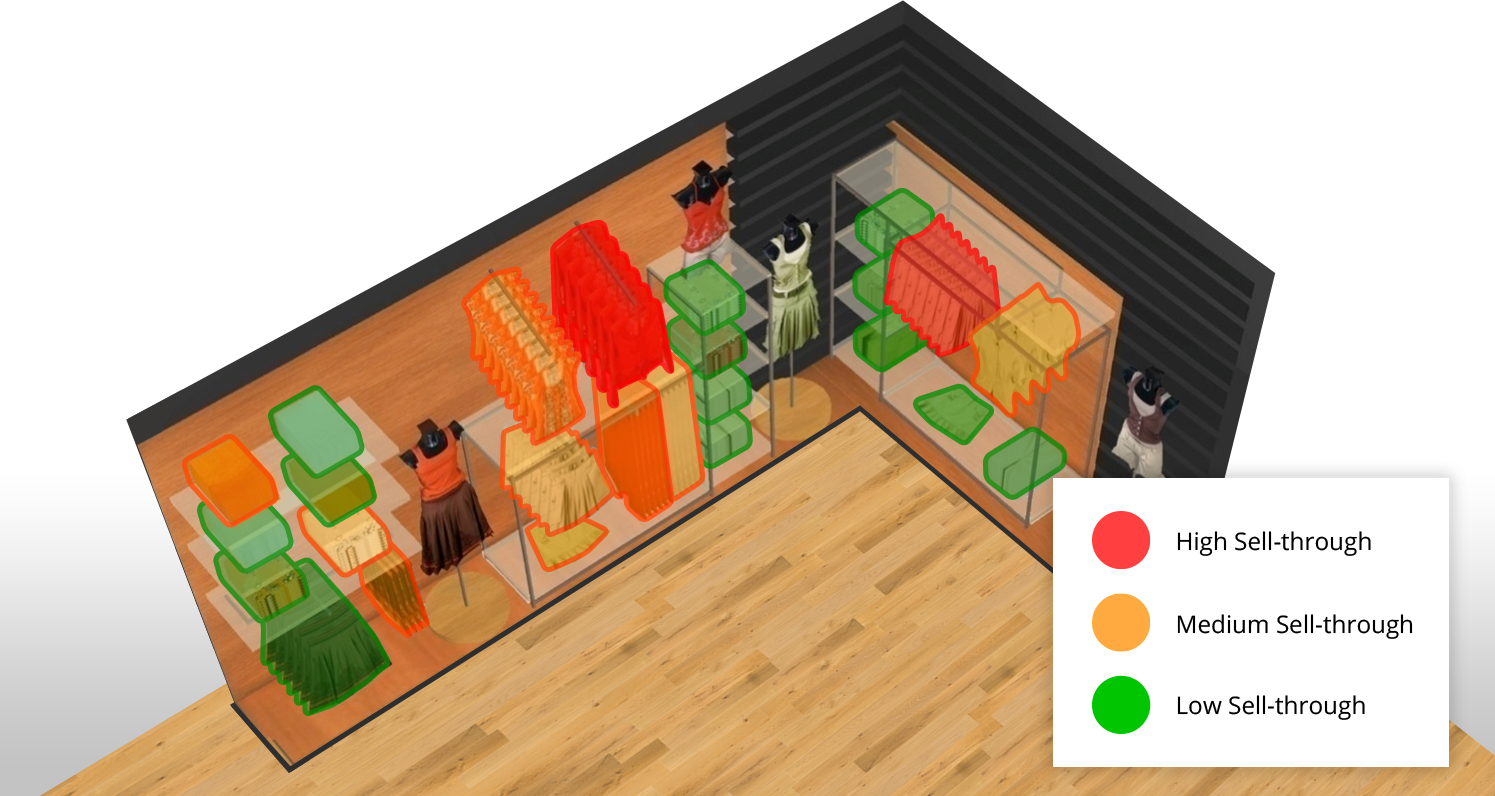
Show your sell through data
Represented as a percentage, sell-through data shows how many products are sold to customers in comparison to how much inventory and stock has been received. Overlaying a heatmap onto your store with sell-through data gives you an immediate overview of what products have the highest sell-through in your store - and exactly where. This helps greatly in your merchandising and store layout, as you can look to move products with a low sell-through rate to a more highly foot-trafficked area, lower the price, or simply order less of the product for next month.
Analyzing sell through data helps greatly in inventory management - and being able to predict how much a given store needs to be stocked with a certain product is vital in keeping monthly margins high.
Analyze your product placement
Where products are placed in relation to their retail pricing is a key tenet of Visual Merchandising principles. Placing lower value products near PoS (point of sale) areas - to assist in up-sells - is a common tactic, whilst higher value products tend to be placed nearer the back of the store to direct the customer journey to the higher ticket items.
With a heat map overlaid on top of your store displaying price points, you can mix and move product collections and merchandised fixtures with easy to consume, actionable information. Digital tools - like our own MockShop - exist to make it easy to do this. For example, you can click to show all of the products priced over a certain threshold and highlight where in the 3D store environment they are located. You can then test out all sorts of price configurations to match your own Visual Merchandising and store layout principles.
Balance the price of your collections
A well balanced product collection isn't just about ensuring the right styles and colors are present, it's important to create and merchandise collections in a similar price range. For example, if there is a shirt on a top rack marked at $ 60 combined with another at $ 15 next to it, this doesn't help a customer's purchasing cycle. It makes them think about why there is such a price discrepancy. When it comes to consumer psychology, thinking is something you want to minimize - and action is something you want to encourage.
By using a heat map in a digital environment, your planning teams can see where collections and store fixtures are unbalanced when it comes to pricing. They can then feed this important information to your buying teams who can then ensure that they purchase the right inventory at a concurrent price point, look to balance the product ranges across the store more effectively, or merchandise the products on completely different fixtures.
Highlight products by material, style, color - and more
Color balancing is an important part of the visual artistry in Visual Merchandising. A well color-balanced range is simply more aesthetically appealing. But material can also be important - for example a heat map in a 3D environment that can show all products made with leather can be greatly useful when putting together, for example a seasonal jacket display - or showcasing a current trend in fashion.
When it comes to product style, another way heatmaps help is that you can simply show all jackets in your 3D store environment, for example. This heatmap can give you an immediate overview of how many jackets are in your store and where they are placed. You can feed this information back to your buying and planning teams to either increase or decrease the amount purchased, or your Visual Merchandising teams can use the data to place the products in more tactical locations - leading to an improved customer experience and higher sell-through margins.
Improve collaboration between buying, planning and merchandising teams
In many large retail operations, integrating a seamless process between buying, planning and merchandising is a key pain point. Considering the wider retail flow - which we describe as the sequence of planning, buying, merchandising, execution and compliance - providing them with a common goal through data visualisation can help a great deal in making these processes both more efficient, and better performing.
With a simple visual overview of complex product and sales data that a heatmap provides, your retail teams will be better informed when it comes to any stage of the retail flow. Whether it's creating a store planogram to send as part of a new merchandising directive, or creating a new product range to reflect a more balanced collection, your store performance will be markedly improved by a more efficient, effective retail flow.